


|
|
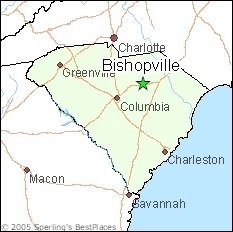
In the depths of Scape Ore Swamp, Lee County harbors a mystery that tranfixes the Carolinian imagination, a enigma that beckons seekers of the inexplicable. Bishopville's Lizard Man emerges as a spectral figure, suspended between the known and the arcane, where experiencers, their accounts woven with fear and awe, speak of a behemoth adorned in scales, an elusive apparition who navigates the dank, murky recesses with preternatural grace. In a realm where the palpable and ethereal converge, the Lizard Man lurks beyond our veil of comprehension. |
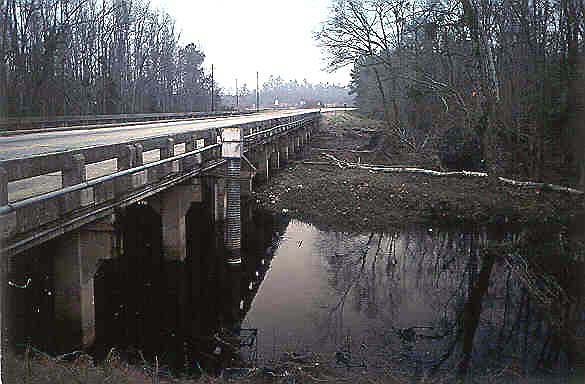 |
The basin lies in the Outer Coastal Plain Mixed Forest ecoregion, which is characterized by temperate evergreen forests (Bailey and others, 1994). Forests on hillslopes and upland areas are dominated by southern pine and upland hardwood communities; the dominant species are loblolly pine, longleaf pine, slash pine, shortleaf pine, oak, and hickory. The flood plains are covered by lowland hardwood forests of water tupelo, swamp tupelo, water oak, and bald cypress. Most soils in the basin are classified as Ultisols and mapped in the Alpin and Blanton soil series (Mitchell, 1990). These soils are formed in sandy marine sediments and are generally found on broad ridgetops and side slopes of sand hills. A typical profile has a sandy surface layer, 10 to 30 cm thick, overlying a sandy to loamy subsoil down to a depth of 200 cm. Because of the high sand content, these soils are highly permeable and acidic (pH 4.5 to 6.0) and have a low nutrient-holding capacity. Poorly drained soils in relatively narrow strips along the flood plains are mapped in the Johnson Series (Mitchell, 1990). A typical Johnson soil has a black loam surface layer about 75 cm thick overlying a grayish sandy loam sublayer. The dominant minerals in all soils are quartz and kaolinite (Mitchell, 1990).
The basin is underlain by Upper Cretaceous sediments of the Tuscaloosa Formation (Cooke, 1936). The Tuscaloosa Formation consists of fluvial and marine sediments assumed to be derived from weathered crystalline rocks of the Piedmont. Cooke (1936) described the sediments as light-colored arkosic sands composed of quartz, feldspar, and muscovite, interlayered with lenses of light-colored clay. Argillaceous sands of the Eocene Black Mingo Formation underlie the basin near the gage but are covered by sandy Pleistocene terrace deposits.
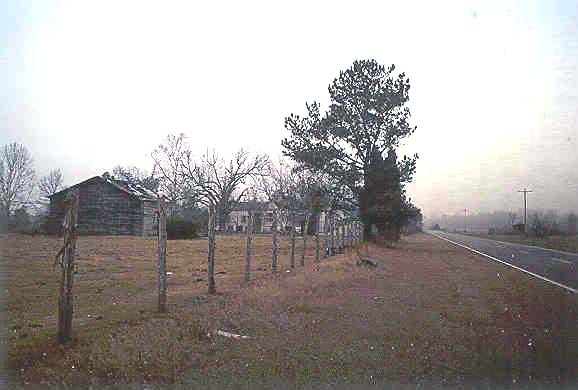
The Scape Ore Swamp Basin drains parts of Lee and Kersaw Counties. Land ownership in the basin is 96 percent private and 4 percent Federal, State, and county (Mike Newman, Natural Resources Conservation Service, written commun., 1996). More than 200 km of primary and secondary roads provide access to most areas of the basin. Because of swampy conditions along most of the stream channels, roads tend to follow the sand hills summits rather than parallel the drainages. A 13-km segment of Interstate 20 crosses the center of the basin in the east-west direction. Land use in the basin is 60 percent forest and 40 percent crop and pasture land. Farmland is more commonly situated on the hillslopes and broad summits of the sand hills, whereas forested areas are concentrated along the drainages. Most farms in the basin are relatively small (average size 70 ha) and generally produce soybeans, corn, peanuts, and cotton; pasture lands are covered by a mixture of Coastal Bermuda, Common Bermuda, annuals, and native grasses (Mike Newman, written commun., 1996). About 30 small impoundments located in the basin are primarily used for irrigation and recreational fishing. Residents in the basin use ground water as their primary domestic water supply. A major resource problem in the basin is soil loss from highly erodible cropland, which results in damage to streams, roads, and property (Lynn Newton, Natural Resources Conservation Service, written commun., 1996). The U.S. Department of Agriculture instituted the Conservation Reserve Program (CRP) in 1985 as a means of reducing soil erosion by paying farmers to plant permanent vegetation types, such as grasses and pines. About 20 percent of agricultural land in the basin is currently managed under the CRP (Wayde Ross, Natural Resources Conservation Service, written commun., 1996).
.gif)
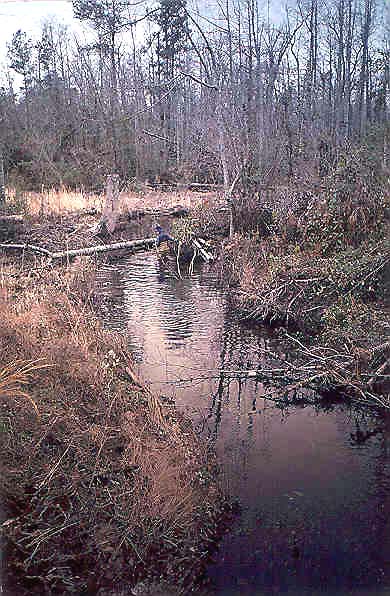
The data set analyzed for this report includes 212 water-quality samples that were collected from August 1970 through September 1995. Sampling frequency was monthly from 1971 through 1982 and bimonthly from 1983 through 1995. Although not documented, water-quality samples in the early part of the record probably were analyzed at USGS laboratory in Raleigh, N.C., which was operated until 1973 (Durum, 1978). After establishment of the USGS Central Laboratory System, samples were analyzed at the Atlanta laboratory from 1973 through 1985 and at the NWQL in Arvada, Colo., from 1986 through 1995. Daily discharge records for Scape Ore Swamp (station 02135300) are available beginning in July 1978.
 |
Calculated ion balances for 205 samples with complete major ion analyses are shown in Figures 25a and 25b. Temporal variation of discharge, field pH, major ion concentrations, and ion balance at Scape Ore Swamp, South Carolina. Ion balances ranged from -45 to +31 percent and more than 65 percent of samples had values within the ±10 percent range, indicating that the analytical measurements were generally of good quality. The average charge balance for all samples was 1.1 percent, indicating measured cations and anions were close to balanced. Time-series plots of the major dissolved constituents were inspected for evidence of method-related effects (fig. 25). Several patterns are evident at the Scape Ore station. For example, elevated sulfate concentrations were reported for most samples during the late 1980's.This pattern coincides with the use of a turbidimetric titration for sulfate analyses at the NWQL between March 1986 and December 1989 (Fishman and others, 1994). In 1989, the NWQL determined that sulfate concentrations can be overestimated by this technique and changed the method to ion chromatography in 1990 (Office of Water Quality Technical Memorandum No. 90.04, Turbidimetric Sulfate Method, issued December 21, 1989, at URL http://water.usgs.gov/admin/memo/). Uncharacteristically high calcium concentrations also were evident during the period 1974 through 1976. Interestingly, a similar pattern of high calcium concentrations also was observed at the Wild River station in Maine during the same period of record. Because samples from these two sites were analyzed at different laboratories during this period, it seems likely that high calcium concentrations may be related to collection or processing procedures common to both stations. The only documented procedural change during this period was the introduction of a polypropylene churn splitter for compositing and splitting samples that was required for use at all HBN stations beginning in water year 1977 (Office of Water Quality Technical Memorandum No. 76.24-T, Sample Splitter for Water-Sediment Samples, issued August 16, 1976, at URL http://water.usgs.gov/ public/admin/memo/). Although problems with previous sample splitters were not documented by the Office of Water Quality (OWQ), the fact that the anomalous pattern disappeared around the beginning of 1977 indicates that previous splitters or compositing devices may have been a potential source of contamination. Temporal patterns in pH also reveal potential bias in the field determinations. Between 1983 and 1985, field pH values were 0.5 to 1 pH unit smaller than values typically reported for this station. A possible cause of this shift was the gel-filled pH probe used by field personnel in the USGS office in South Carolina during this period of record (John Barton, USGS, oral commun., 1996). Some instrument-electrode systems are known to give erroneous readings when measuring pH in low-conductivity waters, and the electrode commonly is the critical component (Office of Water Quality Technical Memorandum No. 81.08, Electrodes for pH Measurement in Low-Conductivity Waters, issued February 10, 1981, at URL http://water.usgs.gov/admin/memo/).
Median concentrations and ranges of major constituents in stream water collected at the HBN gaging station and VWM concentrations in wet-only deposition measured at the Santee National Wildlife Refuge NADP station about 60 km south of the basin are presented in table 46. Precipitation chemistry at the NADP station was dilute and acidic with a VWM pH of 4.6 for 10 years of record. The dominant cations were hydrogen, which contributed 45 percent of the cation charge, and sodium, which contributed 18 percent. Sulfate accounted for 54 percent of the total anions, and nitrate and chloride each accounted for 23 percent. These results suggest that precipitation at the NADP station probably is a mixture of both anthropogenic emissions of sulfate and nitrogen compounds and salt derived from marine aerosols.
[Concentrations in units of microequivalents per liter, discharge in cubic meters per second, specific conductance in microsiemens per centimeter at 25 degrees Celsius, pH in standard units, and silica in micromoles per liter; n, number of stream samples; VWM, volume-weighted mean; inst., instantaneous; spec. cond., specific conductance; <, less than; --, not reported]
aValues are volume-weighted mean concentrations for 1984-94.
bLaboratory pH.
cNitrate only.
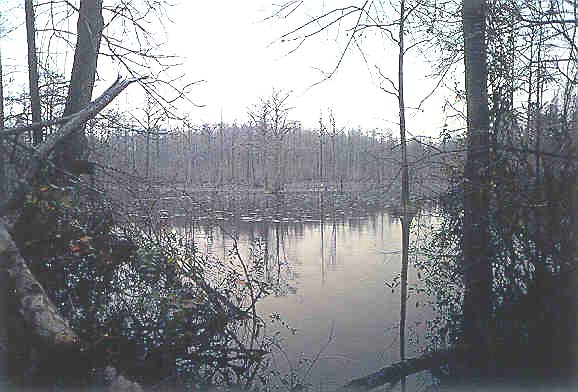
Stream water in the Scape Ore Swamp is dilute and weakly buffered; total ionic constituents ranged from 210 to 860 meq/L, and alkalinities were generally below 70 meq/L. The major cation in stream water was sodium, and the dominant anion was chloride. The low concentrations of the major weathering products, particularly alkalinity, are attributed to the slow weathering rates of the quartz-rich soils and sediments in the basin. The median chloride concentration in stream water was 120 meq/L, which was about 10 times larger than the VWM concentration of chloride in precipitation. Based on the difference between annual precipitation and runoff, evapotranspiration can account for no more than a threefold increase in the chloride concentration of precipitation, indicating that a substantial amount of stream-water chloride is derived from sources other than precipitation. Considering the proximity of this site to the coast, dry deposition of marine aerosols probably is the dominant source of chloride (and sodium) in stream water. Chloride also may be
 |
The solute composition of stream water was further evaluated by analyzing correlations between solutes and stream discharge (table 47). Discharge was poorly correlated with most dissolved constituents with the exception of weak inverse correlations with pH (rho = -0.588), sodium (rho = -0.0462), and alkalinity (rho = -0.536). Solutes in stream water also were poorly correlated with each other with the exception of a weak positive correlation between calcium and magnesium (rho = 0.551). The lack of strong correlations among these constituents probably is related both to hydrologic and geochemical factors. The highly permeable soils and sediments on the hillslopes and upland surfaces allow precipitation to infiltrate quickly into the ground-water system. In turn, streamflow is supplied by ground-water discharge, which maintains a relatively constant flow rate and stream composition throughout the year. Additionally, the quartz-rich soils and sediments contain few weatherable minerals and, as a consequence, produce soil and ground waters that are not significantly different in composition from that of the incoming precipitation.
[Q, discharge; Ca, calcium; Mg, magnesium; Na, sodium; K, potassium; Alk, alkalinity; SO4, sulfate; Cl, chloride; Si, silica]
| Q | pH | Ca | Mg | Na | K | Alk | SO4 | Cl | |
| pH | -0.588 | ||||||||
| Ca | .149 | -0.235 | |||||||
| Mg | .047 | -.083 | 0.551 | ||||||
| Na | -.462 | .165 | .294 | 0.294 | |||||
| K | .311 | -.193 | .350 | .409 | -0.052 | ||||
| Alk | -.536 | .504 | -.089 | .043 | .159 | -0.157 | |||
| SO4 | .243 | -.357 | .102 | .204 | .199 | .044 | -0.321 | ||
| Cl | .114 | -.28 | .198 | .390 | .264 | 259 | -203 | 0.171 | |
| Si | -.251 | -.005 | .156 | .291 | .301 | 071 | 014 | -003 | 0.426 |
Results of the seasonal Kendall test for trends in discharge and major dissolved constituents from 1970 through 1995 are shown in table 48. Statistically significant upward trends were observed for unadjusted magnesium, potassium, and chloride concentrations at the 0.01 confidence level. The flow-adjusted concentrations of magnesium were not tested for trends because the flow model was not statistically significant at a = 0.1. The unadjusted and flow-adjusted trends were similar for potassium and chloride, indicating that the trends were not driven by variations in stream discharge. The
 |
[Trends in units of microequivalents per liter per year, except discharge in cubic meters per second per year, pH in standard units per year, and silica in micromoles per liter per year; <, less than; --, not calculated]
| Parameter | Unadjusted | Flow adjusted | ||
| Trend | p-value | Trend | p-value | |
| Discharge | -0.01 | 0.554 | -- | -- |
| pH, field | <.01 | .849 | <-0.01 | 0.906 |
| Calcium | .1 | .214 | (a) | -- |
| Magnesium | .7 | .000 | (a) | -- |
| Sodium | <.1 | .914 | -.2 | .509 |
| Potassium | .1 | .008 | .2 | .007 |
| Alkalinity, laboratory | <.1 | .318 | .2 | .485 |
| Sulfate | -.7 | .132 | -.9 | .093 |
| Chloride | .8 | .002 | .9 | .001 |
| Nitrite plus nitrate | <.1b | .601 | -- | -- |
| Silica | .6 | .103 | .5 | .093 |
a Flow model not significant at a = 0.10.
b Trend calculated for 1973-95, using a trend test for censored data.
Results of the surface-water synoptic sampling of January 10 and 11, 1991, are presented in table 49; locations of sampling sites are shown in figure 24. Discharge at the gage was 2.27 m³/s compared to the median daily discharge of 3.68 m³/s for January (Lawrence, 1987), indicating that the basin was sampled during base-flow conditions for that time of year. Solute concentrations measured at the gage (site 1) during the synoptic sampling were generally below the first-quartile concentrations reported for the gage during the entire period of record (table 46). The tributary streams were extremely dilute, and sodium and chloride were the dominant ions. Measured alkalinities were below the detection limit at 9 of the 12 sites, and pH ranged from 4.92 to 6.54, indicating that most surface waters were slightly acidic. The source of most stream-water acidity probably is organic acids, although some may be derived from strong acids in precipitation. Although DOC was not measured in this study, all samples had positive ion balances (range 3.8 to 14 percent), inferring that organic anions were an important component of stream water during the sampling period.
[Site locations shown in fig. 24; Q, discharge in cubic meters per second; SC, specific conductance in microsiemens per centimeter at 25 degrees Celsius; pH in standard units; Ca, calcium; Mg, magnesium; Na, sodium; K, potassium; Alk, alkalinity; SO4, sulfate; Cl, chloride; NO3, nitrate; concentrations in microequivalents; Si, silica in micromoles per liter; <, less than, --, not measured]
| Site | Station number | Q | SC | pH | Ca | Mg | Na | K | Alk | SO4 | Cl | NO3 | Si | Criteriaa | Remarks |
| 1 | 02135300 | 2.27 | 26 | 4.98 | 32 | 40 | 96 | 15 | <10 | 31 | 130 | 6.4 | 63 | -- | -- |
| 2 | 340910080184900 | .62 | 27 | 5.88 | 35 | 42 | 140 | 19 | 39 | 17 | 140 | 19 | 87 | MT, LU | Significant development |
| 3 | 341230080195100 | .042 | 22 | 5.45 | 19 | 30 | 120 | 13 | <10 | 21 | 120 | 2.9 | 120 | BG | Black Mingo Shale |
| 4 | 341321080210300 | .093 | 18 | 5.81 | 22 | 34 | 78 | 9.7 | <10 | 23 | 110 | 2.9 | 90 | MT, LU | Reservoir in subbasin |
| 5 | 341335080214900 | -- | 25 | 4.90 | 33 | 45 | 83 | 15 | <10 | 38 | 130 | 2.9 | 87 | MT, LU | Upstream from most development |
| 6 | 341322080221300 | -- | 23 | 5.28 | 21 | 30 | 110 | 14 | <10 | 20 | 120 | 1.4 | 130 | LU | I—20 crosses subbasin |
| 7 | 341141080241800 | .062 | 29 | 6.54 | 60 | 55 | 130 | 28 | 110 | 15 | 130 | 2.9 | 38 | LU | Downstream from large impoundment |
| 8 | 341232080253400 | .006 | 34 | 5.89 | 60 | 67 | 160 | 13 | 43 | 25 | 140 | 30 | 92 | LU | Upstream from large impoundment |
| 9 | 341354080223200 | .15 | 25 | 5.14 | 31 | 40 | 96 | 18 | <10 | 38 | 140 | 5.0 | 130 | LU | No I—20 influence |
| 10 | 341528080231900 | .71 | 26 | 4.92 | 40 | 47 | 87 | 18 | <10 | 42 | 130 | 2.1 | 110 | MT, LU | Forested, little development |
| 11 | 341539080263100 | .13 | 27 | 5.13 | 45 | 48 | 74 | 26 | <10 | 58 | 120 | 4.3 | 100 | MT, LU | Forested, little development |
| 12 | 341812080221000 | .27 | 25 | 4.99 | 36 | 54 | 65 | 21 | <10 | 40 | 120 | 7.9 | 67 | LU | Primarily forested |
aCriteria used in selection of sampling sites: BG = bedrock geology, MT = major tributary, LU = land use.
In general, stream chemistry did not vary markedly among the sampling sites. For example, specific conductance ranged from 18 to 34 µS/cm, and most dissolved constituents did not vary by more than a factor of three. This result primarily reflects the uniform composition and slow weathering rate of soils and sediments in the basin. Some subtle variations in stream chemistry are evident, however, which may reflect the influence of factors other than geology. For example, samples that were collected in the Beaverdam Creek subbasin (sites 2, 7, and 8) had elevated concentrations of calcium, alkalinity, and nitrate. These solutes are common components of fertilizer and sewage, and their elevated concentrations may be indicative of human disturbance in this subbasin. Substantial differences also were observed in Beaverdam Creek upstream from (site 8) and downstream from (site 7) McLeods Pond. For example, alkalinity concentrations almost tripled downstream from the pond, whereas nitrate concentrations decreased by a factor of 10. This change in stream chemistry indicates that the impoundment may have a strong influence on stream-water chemistry in this tributary. Chloride, which is commonly used as an indicator of human activities, was remarkably uniform over the basin and ranged from 110 to 140 meq/L. In contrast, sodium concentrations varied by more than a factor of two. Interestingly, streams in the northern one-half of the basin (sites 4, 5, 9, 10, 11, and 12) had an average sodium-to-chloride ratio of 0.6, whereas sites in the southern one-half of the basin (sites 2, 3, 6, 7, and 8) had an average ratio of 1.0. Sulfate also differed slightly between tributaries that drain the upper and lower parts of the basin. For example, sulfate averaged 40 meq/L in the northern tributaries compared to 20 meq/L in the southern tributaries. These differences in stream chemistry may be related, in part, to land-use patterns in the basin. Subbasins in the northern one-half of the basin are primarily forested, whereas those in the southern one-half have a greater percentage of agricultural land.
Bailey, R.G., Avers, P.E., King, T., and McNab, W.H., eds., 1994, Ecoregions and subregions of the United States with supplementary table of map unit descriptions: Washington, D.C., U.S. Department of Agriculture Forest Service, scale 1:7,500,000 (also at URL http://www.fs.fed.us/land/ecosysmgmt/ecoreg1_home.html).
Cooke, Wythe B., 1936, Geology of the Coastal Plain of South Carolina: U.S. Geological Survey Bulletin 867, 196 p., 2 maps, scale 1:500,000.
Durum, W.H., 1978, Historical profile of quality of water laboratories and activities, 1879-1973: U.S. Geological Survey Open-File Report 78-432, 235 p.
Elwood, J.W., Sale. M.J., and Kaufman, P.R., 1991, The Southern Blue Ridge Province, in Charles, D.F., ed., Acidic deposition and aquatic ecosystems-Regional case studies: New York, Springer-Verlag, p. 319-364.
Fishman, M.J., Raese, J.W., Gerlitz, C.N., and Husband, R.A., 1994, U.S. Geological Survey approved inorganic and organic methods for the analysis of water and fluvial sediment, 1954-94: U.S. Geological Survey Open-File Report 94-351, 55 p.
Lawrence, C.L., 1987, Streamflow characteristics at hydrologic bench-mark stations: U.S. Geological Survey Circular 941, 123 p.
Mitchell, Cleveland J., Jr., 1990, Soil survey of Kershaw County area, South Carolina: U.S. Department of Agriculture Soil Conservation Service, 165 p.
U.S. Geological Survey, published annually, Water resources data, South Carolina, Columbia: U.S. Geological Survey Water Data Report.
a. U.S. Geological Survey topographic maps:
b. Geologic maps:
c. Soil surveys:
d. Other maps:
Table B-1. NWIS site identification numbers and site names for water-quality sampling sites.
| Site | Identification Number | Site Name |
| 1 | 02135300 | SCAPE ORE SWAMP NEAR BISHOPVILLE, SOUTH CAROLINA |
| 2 | 340910080184900 | BEAVERDAM CREEK AT MOUTH |
| 3 | 341230080195100 | GUM SPRINGS BRANCH |
| 4 | 341321080210300 | CEDAR CREEK |
| 5 | 341335080214900 | SCAPE ORE SWAMP ABOVE I-20 |
| 6 | 341322080221300 | I-20 BRANCH |
| 7 | 341141080241800 | BEAVERDAM CREEK AT MCLEODS POND |
| 8 | 341232080253400 | UPPER BEAVERDAM CREEK |
| 9 | 341354080223200 | SOUTH MCGEE BRANCH |
| 10 | 341528080231900 | TIMBER CREEK |
| 11 | 341539080263100 | NANCY BROOK |
| 12 | 341812080221000 | BLACK CREEK AT COUNTY LINE |
| Back to 1173-A Contents |